首页 > Python资料 博客日记
python爬取天气数据并做可视化分析
2024-06-26 12:00:04Python资料围观180次
文章python爬取天气数据并做可视化分析分享给大家,欢迎收藏Python资料网,专注分享技术知识
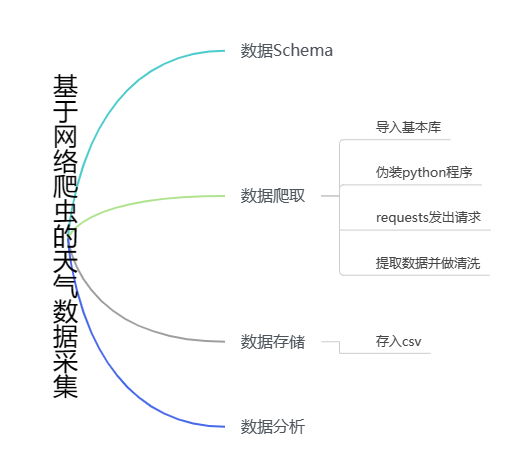
数据采集逻辑

数据schema
历史天气数据schema
{
‘当日信息’:'2023-01-01 星期日',
'最高气温': 8℃'',
'最低气温': '5℃',
‘天气’: '多云',
'风向信息':'北风 3级'
}
数据爬取
1.导入库
import numpy as np
import pandas as pd
import requests
from bs4 import BeautifulSoup
from matplotlib import pyplot as plt
from pandas import Series, DataFrame
2.对程序进行伪装
headers = {
    'Host': 'lishi.tianqi.com',
    'user-agent': 'Mozilla/5.0 (Windows NT 10.0; Win64; x64) AppleWebKit/537.36 (KHTML, like Gecko) Chrome/110.0.0.0 Safari/537.36 Edg/110.0.1587.63'
}
3.抓取天气数据
url = 'https://lishi.tianqi.com/shanghai/202301.html'  # 上海 2023年1月天气
res = requests.get(url, headers=headers)

res.encodind = 'utf-8'
html = BeautifulSoup(res.text, 'html.parser')
data_all = []
tian_three = html.find("div", {"class": "tian_three"})
lishi = tian_three.find_all("li")
for i in lishi:
    lishi_div = i.find_all("div")
    data = []
    for j in lishi_div:
        data.append(j.text)
    data_all.append(data)
print(data_all)
4.数据存储
在数据存储前,对数据进行处理,便于后期的数据分析。将上面的“当天信息”字段拆分为“日期”和“星期”两个字段,“风向信息”也是如此。最后,将数据保存为csv文件中。
weather = pd.DataFrame(data_all)
weather.columns = ["当日信息", "最高气温", "最低气温", "天气", "风向信息"]
weather_shape = weather.shape
print(weather)
weather['当日信息'].apply(str)
result = DataFrame(weather['当日信息'].apply(lambda x: Series(str(x).split(' '))))
result = result.loc[:, 0:1]
result.columns = ['日期', '星期']
weather['风向信息'].apply(str)
result1 = DataFrame(weather['风向信息'].apply(lambda x: Series(str(x).split(' '))))
result1 = result1.loc[:, 0:1]
result1.columns = ['风向', '级数']
weather = weather.drop(columns='当日信息')
weather = weather.drop(columns='风向信息')
weather.insert(loc=0, column='日期', value=result['日期'])
weather.insert(loc=1, column='星期', value=result['星期'])
weather.insert(loc=5, column='风向', value=result1['风向'])
weather.insert(loc=6, column='级数', value=result1['级数'])
weather.to_csv("上海23年1月天气.csv", encoding="utf_8")
5.数据分析
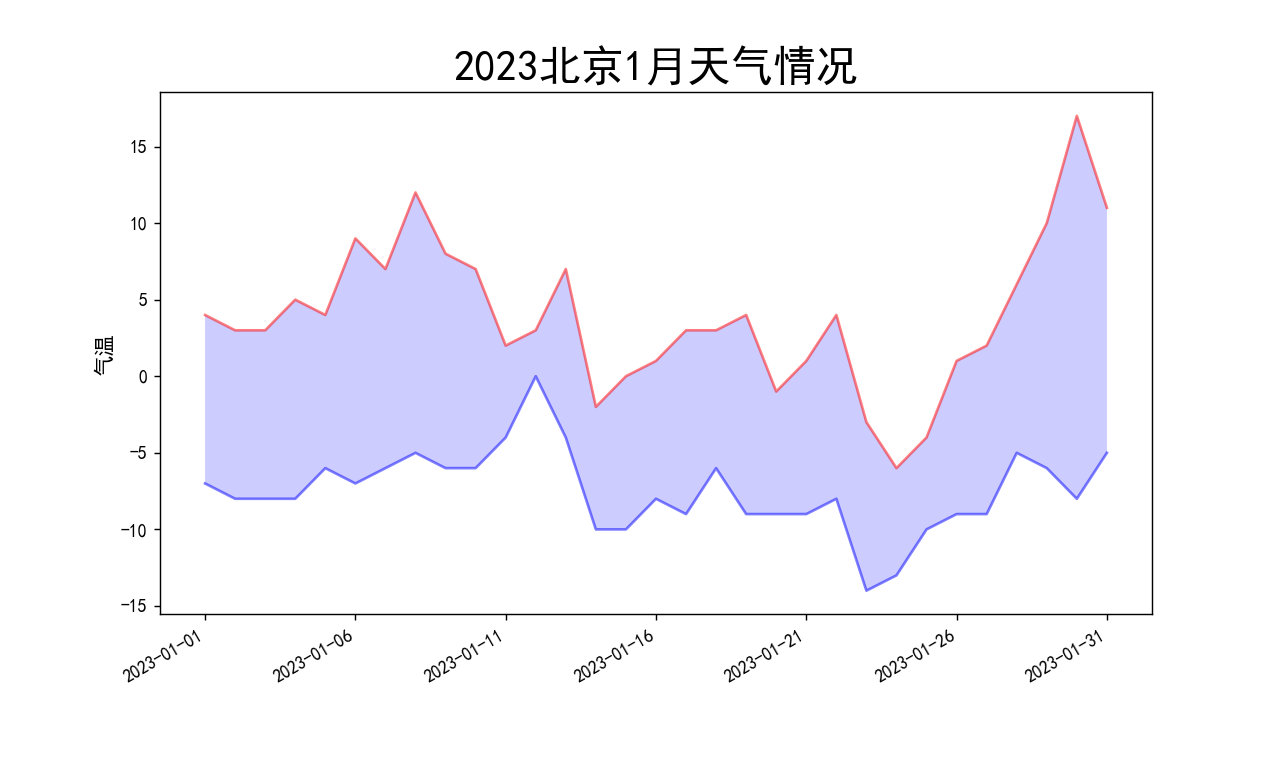
注:数据分析用的是北京2023年1月的天气数据,如下图:

1.2023北京1月天气情况
# 数据处理
plt.rcParams['font.sans-serif'] = ['SimHei']
plt.rcParams['axes.unicode_minus'] = False


weather['最高气温'] = weather['最高气温'].map(lambda x: int(x.replace('℃', '')))
weather['最低气温'] = weather['最低气温'].map(lambda x: int(x.replace('℃', '')))

dates = weather['日期']
highs = weather['最高气温']
lows = weather['最低气温']

# 画图

fig = plt.figure(dpi=128, figsize=(10, 6))

plt.plot(dates, highs, c='red', alpha=0.5)
plt.plot(dates, lows, c='blue', alpha=0.5)

plt.fill_between(dates, highs, lows, facecolor='blue', alpha=0.2)
# 图表格式
# 设置图标的图形格式
plt.title('2023北京1月天气情况', fontsize=24)
plt.xlabel('', fontsize=6)
fig.autofmt_xdate()
plt.ylabel('气温', fontsize=12)
plt.tick_params(axis='both', which='major', labelsize=10)
# 修改刻度
plt.xticks(dates[::5])
# 显示
plt.show()
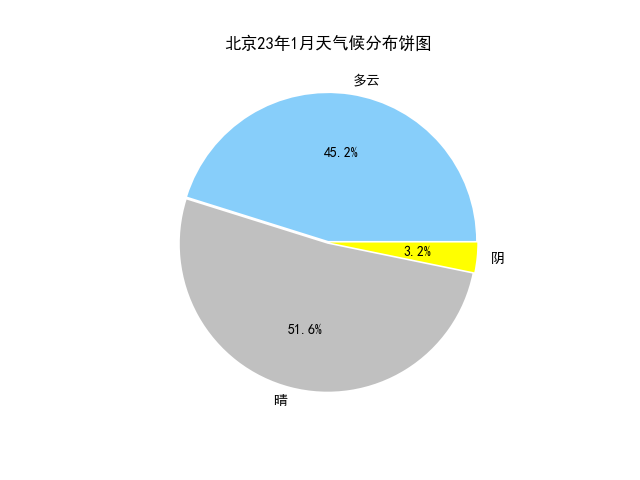
2.北京23年1月天气候分布饼图
2023年一月份有31天,循环遍历时注意循环次数。
# 天气可视化饼图
weather = list(weather['天气'])
dic_wea = {}
for i in range(0, 31):
    if weather[i] in dic_wea.keys():
        dic_wea[weather[i]] += 1
    else:
        dic_wea[weather[i]] = 1
print(dic_wea)
explode = [0.01] * len(dic_wea.keys())
color = ['lightskyblue', 'silver', 'yellow', 'salmon', 'grey', 'lime', 'gold', 'red', 'green', 'pink']
plt.pie(dic_wea.values(), explode=explode, labels=dic_wea.keys(), autopct='%1.1f%%', colors=color)
plt.title('北京23年1月天气候分布饼图')
plt.show()
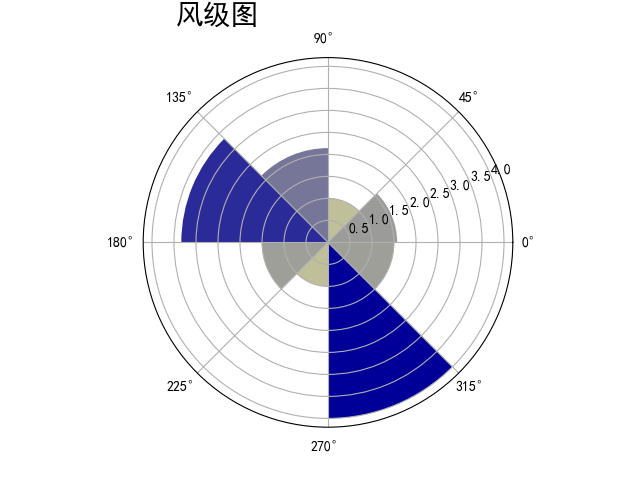
3.风级图
自定义change_wind函数,将风向信息转换为数值,并计算出各风向的风速平均值。
def change_wind(wind):
    """改变风向"""
    for i in range(0, 31):
        if wind[i] == "北风":
            wind[i] = 90
        elif wind[i] == "南风":
            wind[i] = 270
        elif wind[i] == "西风":
            wind[i] = 180
        elif wind[i] == "东风":
            wind[i] = 360
        elif wind[i] == "东北风":
            wind[i] = 45
        elif wind[i] == "西北风":
            wind[i] = 135
        elif wind[i] == "西南风":
            wind[i] = 225
        elif wind[i] == "东南风":
            wind[i] = 315
    return wind


# 风向雷达图
wind = list(weather['风向'])
weather['级数'] = weather['级数'].map(lambda x: int(x.replace('级', '')))
# weather['级数']=pd.to_numeric(weather['级数'])
wind_speed = list(weather['级数'])
wind = change_wind(wind)


degs = np.arange(45, 361, 45)
temp = []
for deg in degs:
    speed = []
    # 获取 wind_deg 在指定范围的风速平均值数据
    for i in range(0, 31):
        if wind[i] == deg:
            speed.append(wind_speed[i])
    if len(speed) == 0:
        temp.append(0)
    else:
        temp.append(sum(speed) / len(speed))
print(temp)
N = 8
theta = np.arange(0. + np.pi / 8, 2 * np.pi + np.pi / 8, 2 * np.pi / 8)
# 数据极径
radii = np.array(temp)
# 绘制极区图坐标系
plt.axes(polar=True)
# 定义每个扇区的RGB值(R,G,B),x越大,对应的颜色越接近蓝色
colors = [(1 - x / max(temp), 1 - x / max(temp), 0.6) for x in radii]
plt.bar(theta, radii, width=(2 * np.pi / N), bottom=0.0, color=colors)
plt.title('风级图', x=0.2, fontsize=20)
plt.show()
版权声明:本文来自互联网用户投稿,该文观点仅代表作者本人,不代表本站立场。本站仅提供信息存储空间服务,不拥有所有权,不承担相关法律责任。如若内容造成侵权/违法违规/事实不符,请联系邮箱:jacktools123@163.com进行投诉反馈,一经查实,立即删除!
标签:
相关文章
最新发布
- 光流法结合深度学习神经网络的原理及应用(完整代码都有Python opencv)
- Python 图像处理进阶:特征提取与图像分类
- 大数据可视化分析-基于python的电影数据分析及可视化系统_9532dr50
- 【Python】入门(运算、输出、数据类型)
- 【Python】第一弹---解锁编程新世界:深入理解计算机基础与Python入门指南
- 华为OD机试E卷 --第k个排列 --24年OD统一考试(Java & JS & Python & C & C++)
- Python已安装包在import时报错未找到的解决方法
- 【Python】自动化神器PyAutoGUI —告别手动操作,一键模拟鼠标键盘,玩转微信及各种软件自动化
- Pycharm连接SQL Sever(详细教程)
- Python编程练习题及解析(49题)
点击排行
- 版本匹配指南:Numpy版本和Python版本的对应关系
- 版本匹配指南:PyTorch版本、torchvision 版本和Python版本的对应关系
- Python 可视化 web 神器:streamlit、Gradio、dash、nicegui;低代码 Python Web 框架:PyWebIO
- Anaconda版本和Python版本对应关系(持续更新...)
- 相关性分析——Pearson相关系数+热力图(附data和Python完整代码)
- Python与PyTorch的版本对应
- Windows上安装 Python 环境并配置环境变量 (超详细教程)
- Python pyinstaller打包exe最完整教程

