首页 > Python资料 博客日记
【SHAP解释运用】基于python的树模型特征选择+随机森林回归预测+SHAP解释预测
2024-07-29 07:00:05Python资料围观289次
1.导入必要的库
import pandas as pd
import numpy as np
import matplotlib.pyplot as plt
import seaborn as sns
from sklearn.model_selection import train_test_split
from sklearn.ensemble import RandomForestRegressor
from sklearn.tree import export_graphviz
#from sklearn.inspection import plot_partial_dependence
from sklearn.metrics import mean_squared_error
import shap
import warnings
2.设置忽略警告与显示字体、负号
warnings.filterwarnings("ignore")

# 设置Matplotlib的字体属性
plt.rcParams['font.sans-serif'] = ['SimHei']  # 用于中文显示,你可以更改为其他支持中文的字体
plt.rcParams['axes.unicode_minus'] = False  # 用来正常显示负号
3.导入数据集
3.1加载数据
# 1. 加载数据
df = pd.read_excel('train.xlsx')
X = df.iloc[:, :-1]  # 特征
y = df.iloc[:, -1]   # 标签
3.2查看数据分布
1.箱线图
plt.figure(figsize=(30, 6))
sns.boxplot(data=df)
plt.title('Box Plots of Dataset Features', fontsize=40, color='black')
# 如果需要设置坐标轴标签的字体大小和颜色
plt.xlabel('X-axis Label', fontsize=20, color='red')  # 设置x轴标签的字体大小和颜色
plt.ylabel('Y-axis Label', fontsize=20, color='green')  # 设置y轴标签的字体大小和颜色

# 还可以调整刻度线的长度、宽度等属性
plt.tick_params(axis='x', labelsize=20, colors='blue', length=5, width=1)  # 设置x轴刻度线、刻度标签的更多属性
plt.tick_params(axis='y', labelsize=20, colors='deepskyblue', length=5, width=1)  # 设置y轴刻度线、刻度标签的更多属性
plt.xticks(rotation=45)  # 如果特征名很长,可以旋转x轴标签
plt.show()
结果如图3-1所示:

图3-1
结果图实在丑陋,这是由数据分布不均衡造成的,这里重点不是数据清洗,就这样凑着用吧。
2.分布图
# 注意:distplot 在 seaborn 0.11.0+ 中已被移除
# 你可以分别使用 histplot 和 kdeplot

plt.figure(figsize=(50, 10))
for i, feature in enumerate(df.columns, 1):
    plt.subplot(1, len(df.columns), i)
    sns.histplot(df[feature], kde=True, bins=30, label=feature,color='blue')
    plt.title(f'QQ plot of {feature}', fontsize=40, color='black')
    # 如果需要设置坐标轴标签的字体大小和颜色
    plt.xlabel('X-axis Label', fontsize=35, color='red')  # 设置x轴标签的字体大小和颜色
    plt.ylabel('Y-axis Label', fontsize=40, color='green')  # 设置y轴标签的字体大小和颜色

    # 还可以调整刻度线的长度、宽度等属性
    plt.tick_params(axis='x', labelsize=40, colors='blue', length=5, width=1)  # 设置x轴刻度线、刻度标签的更多属性
    plt.tick_params(axis='y', labelsize=40, colors='deepskyblue', length=5, width=1)  # 设置y轴刻度线、刻度标签的更多属性
plt.tight_layout()
plt.show()
结果如图3-2所示:

图3-2
3.QQ图
from scipy import stats
plt.figure(figsize=(50, 10))
for i, feature in enumerate(df.columns, 1):
    plt.subplot(1, len(df.columns), i)
    stats.probplot(df[feature], dist="norm", plot=plt)
    plt.title(f'QQ plot of {feature}', fontsize=40, color='black')
    # 如果需要设置坐标轴标签的字体大小和颜色
    plt.xlabel('X-axis Label', fontsize=35, color='red')  # 设置x轴标签的字体大小和颜色
    plt.ylabel('Y-axis Label', fontsize=40, color='green')  # 设置y轴标签的字体大小和颜色

    # 还可以调整刻度线的长度、宽度等属性
    plt.tick_params(axis='x', labelsize=40, colors='blue', length=5, width=1)  # 设置x轴刻度线、刻度标签的更多属性
    plt.tick_params(axis='y', labelsize=40, colors='deepskyblue', length=5, width=1)  # 设置y轴刻度线、刻度标签的更多属性
plt.tight_layout()
plt.show()
结果如图3-3所示:

图3-3
4.树模型特征选择
# 4. 特征选择(使用随机森林的特征重要性)
rf = RandomForestRegressor(n_estimators=100, random_state=42)
rf.fit(X_scaled, y)
importances = rf.feature_importances_
indices = np.argsort(importances)[::-1]

# 可视化特征重要性
plt.figure(figsize=(10,7))
plt.title("Feature importances")
plt.bar(range(X.shape[1]), importances[indices],align="center", color='cyan')
plt.xticks(range(X.shape[1]), [X.columns[i] for i in indices], rotation='vertical')
plt.xlim([-1, X.shape[1]])
plt.show()
特征重要性比较如图4-1所示:

图4-1
5.随机森林回归预测
# 划分训练集和测试集
X_train, X_test, y_train, y_test = train_test_split(X_scaled, y, test_size=0.2, random_state=42)

# 随机森林回归预测
rf_final = RandomForestRegressor(n_estimators=100, random_state=42)
rf_final.fit(X_train, y_train)
y_pred = rf_final.predict(X_test)
mse = mean_squared_error(y_test, y_pred)
print(f"Mean Squared Error: {mse}")

# 预测结果输出与比对
plt.figure()
plt.plot(np.arange(21), y_test[:100], "go-", label="True value")
plt.plot(np.arange(21), y_pred[:100], "ro-", label="Predict value")
plt.title("True value And Predict value")
plt.legend()
plt.show()
预测结果如图5-1所示:

图5-1
由图5-1结合这里的误差Mean Squared Error: 16.092619015714185,说明预测效果很一般,不过本身数据集没有经过清洗,数据分布不合理,有这样的结果也能接受。我一般使用matlab进行数据清晰和标准化,matlab暂时打不开,先搁置,后面我会出数据标准化的文章。
5.SHAP库解释预测
5.1shap库下载安装
这里的shap库我已经下载安装过了,没有下载安装的在pycharm终端、Anaconda Promt终端等等执行命令进行下载安装,最好带上清华镜像源,在网络信号不好时也能顺利安装且节省时间。
pip install -i https://pypi.tuna.tsinghua.edu.cn/simple shap5.2waterfall
shap.plots.waterfall(shap_values[0]) # For the first observation结果如图5-1所示:

图5-1
5.3forceplot
#相互作用图
force_plot1 = shap.force_plot(explainer.expected_value, np.mean(shap_values, axis=0), np.mean(X_test, axis=0),feature_label,matplotlib=True, show=False)
shap_interaction_values = explainer.shap_interaction_values(X_test)
shap.summary_plot(shap_interaction_values,X_test)
结果如图5-2所示:

图5-2
5.4特征影响图
shap.plots.force(explainer.expected_value,shap_values.values,shap_values.data)结果如图5-3所示:

图5-3
5.5特征密度散点图:summary_plot/beeswarm
5.5.1summary_plot
# 创建SHAP解释器
explainer = shap.TreeExplainer(rf)

# 计算SHAP值
shap_values = explainer.shap_values(X_test)

#特征标签
feature_label=['feature1','feature2','feature3','feature4','feature5','feature6','feature7']

plt.rcParams['font.family'] = 'serif'
plt.rcParams['font.serif'] = 'Times New Roman'
plt.rcParams['font.size'] = 13  # 设置字体大小为14
# 现在创建 SHAP 可视化

#配色   viridis  Spectral   coolwarm  RdYlGn  RdYlBu  RdBu  RdGy  PuOr  BrBG PRGn  PiYG
shap.summary_plot(shap_values, X_test,feature_names=feature_label)

#粉红色点:表示该特征值在这个观察中对模型预测产生了正面影响(增加预测值)
#蓝色点:表示该特征值在这个观察中对模型预测产生了负面影响(降低预测值)
#水平轴(SHAP 值)显示了影响的大小。点越远离中心线(零点),该特征对模型输出的影响越大
#图中垂直排列的特征按影响力从上到下排序。上方的特征对模型输出的总体影响更大,而下方的特征影响较小。
# 最上方的特征显示了大量的正面和负面影响,表明它在不同的观察值中对模型预测的结果有很大的不同影响。
# 中部的特征也显示出两种颜色的点,但点的分布更集中,影响相对较小。
# 底部的特征对模型的影响最小,且大部分影响较为接近零,表示这些特征对模型预测的贡献较小
结果如图5-4所示:

图5-4
# 创建SHAP解释器
explainer = shap.TreeExplainer(rf)
# 计算SHAP值
shap_values = explainer.shap_values(X_test)
#特征标签
feature_label=['feature1','feature2','feature3','feature4','feature5','feature6','feature7']
plt.rcParams['font.family'] = 'serif'
plt.rcParams['font.serif'] = 'Times New Roman'
plt.rcParams['font.size'] = 13  # 设置字体大小为14
# 现在创建 SHAP 可视化
#配色   viridis  Spectral   coolwarm  RdYlGn  RdYlBu  RdBu  RdGy  PuOr  BrBG PRGn  PiYG
shap.summary_plot(shap_values,X_test,feature_names=feature_label,cmap='Spectral')
使颜色丰富些如图5-5所示:

图5-5
5.5.2beeswarm
# summarize the effects of all the features
# 样本决策图
shap.initjs()
shap_values = explainer(X_test)
expected_value = explainer.expected_value
shap.plots.beeswarm(shap_values)
结果如图5-6所示:

图5-6
5.6特征重要性SHAP值
shap.summary_plot(shap_values,X_test,feature_names=feature_label,plot_type='bar')
#主要表示绝对重要值的大小,把SHAP value 的样本取了绝对平均值
或者:
shap.plots.bar(shap_values)
结果如图5-7、图5-8所示,本质都是一样的:

图5-7

图5-8
5.7聚类热力图:heatmap plot
#热图
shap.initjs()
shap_values = explainer(X_test)
shap.plots.heatmap(shap_values)
结果如图5-9所示:

图5-9
5.7层次聚类shap值
# 层次聚类 + SHAP值
clust = shap.utils.hclust(X, y, linkage="single")
shap.plots.bar(shap_values, clustering=clust, clustering_cutoff=1)
结果如图5-10所示:

图5-10
5.8决策图
# 样本决策图
shap.initjs()
shap_values = explainer.shap_values(X_test)
expected_value = explainer.expected_value
shap.decision_plot(expected_value, shap_values,feature_label)
结果如图5-11所示:

图5-11
变形1:由数值 -> 概率
# 样本决策图
shap.initjs()
shap_values = explainer.shap_values(X_test)
expected_value = explainer.expected_value
feature_label=['feature1','feature2','feature3','feature4','feature5','feature6','feature7']
shap.decision_plot(expected_value, shap_values, feature_label, link='logit')
结果如图5-12所示:

图5-12
变形2:高亮某个样本线highlight
shap.decision_plot(expected_value, shap_values, feature_label, highlight=12)
结果如图5-13所示:

图5-13
5.9特征依赖图:dependence_plot
5.9.1单个特征依赖
shap.dependence_plot('feature1', shap_values,X_test, interaction_index=None)结果如图5.14所示:

图5-14
5.9.2相互依赖图
shap.dependence_plot('feature3', shap_values,X_test, interaction_index='feature4')结果如图5-15所示:

图5-15
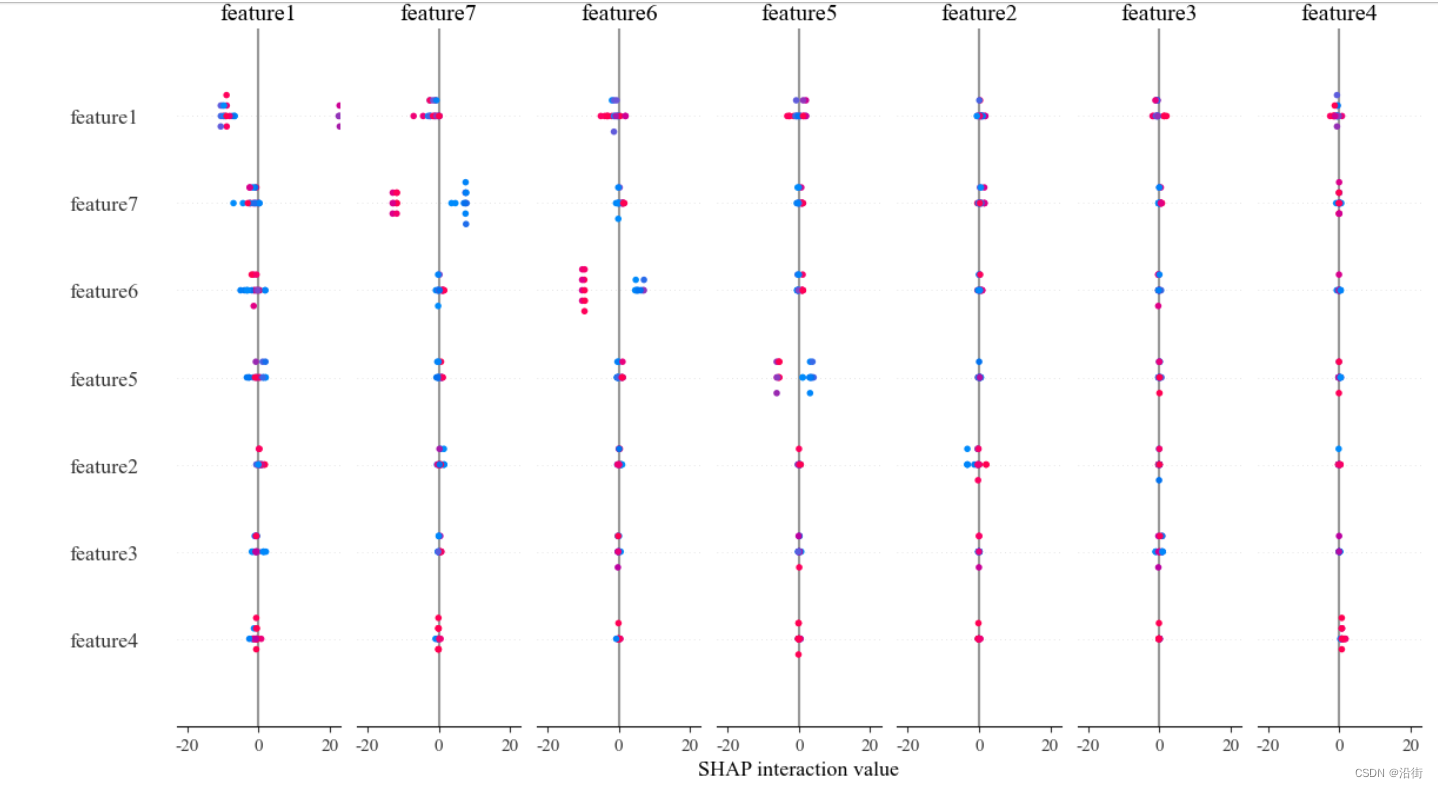
5.10相互作用图:summary_plot
shap.summary_plot(shap_interaction_values,X_test)结果如图5-16所示:

图5-16
具体的每种解释图的含义可以搜寻以下参考文章:
理论借鉴
标签:
上一篇:多个版本的Python如何不冲突?
下一篇:最新Python安装详细教程
相关文章
最新发布
- 光流法结合深度学习神经网络的原理及应用(完整代码都有Python opencv)
- Python 图像处理进阶:特征提取与图像分类
- 大数据可视化分析-基于python的电影数据分析及可视化系统_9532dr50
- 【Python】入门(运算、输出、数据类型)
- 【Python】第一弹---解锁编程新世界:深入理解计算机基础与Python入门指南
- 华为OD机试E卷 --第k个排列 --24年OD统一考试(Java & JS & Python & C & C++)
- Python已安装包在import时报错未找到的解决方法
- 【Python】自动化神器PyAutoGUI —告别手动操作,一键模拟鼠标键盘,玩转微信及各种软件自动化
- Pycharm连接SQL Sever(详细教程)
- Python编程练习题及解析(49题)
点击排行
- 版本匹配指南:Numpy版本和Python版本的对应关系
- 版本匹配指南:PyTorch版本、torchvision 版本和Python版本的对应关系
- Anaconda版本和Python版本对应关系(持续更新...)
- Python 可视化 web 神器:streamlit、Gradio、dash、nicegui;低代码 Python Web 框架:PyWebIO
- 相关性分析——Pearson相关系数+热力图(附data和Python完整代码)
- Python与PyTorch的版本对应
- Windows上安装 Python 环境并配置环境变量 (超详细教程)
- Python pyinstaller打包exe最完整教程

