首页 > Python资料 博客日记
探索Pyecharts关系图绘制技巧:炫酷效果与创意呈现【第42篇—python:Pyecharts关系图】
2024-02-26 05:00:08Python资料围观385次
文章目录
Pyecharts绘制多种炫酷关系网图
引言
在数据可视化领域,关系网图是一种强大的工具,可以展示实体之间的复杂关系。Pyecharts 是一个基于 Echarts 的 Python 可视化库,提供了简单而强大的接口,使得绘制关系网图变得轻松而愉快。本文将介绍 Pyecharts 绘制多种炫酷关系网图的参数说明,并通过代码实战演示如何创建令人印象深刻的关系网图。
准备工作
在开始之前,确保已经安装了 Pyecharts 和相关的依赖库。可以通过以下命令安装:
pip install pyecharts
代码实战
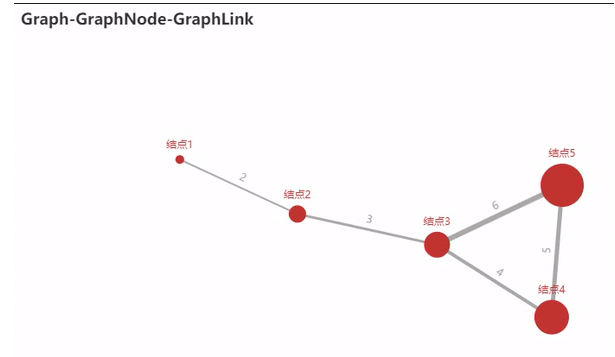
1. 基本关系网图
首先,让我们从一个基本的关系网图开始,展示实体之间的简单连接。
from pyecharts import options as opts
from pyecharts.charts import Graph

# 构造节点和边
nodes = [{"name": "A"}, {"name": "B"}, {"name": "C"}]
links = [{"source": "A", "target": "B"}, {"source": "B", "target": "C"}]

# 创建图表
graph = (
    Graph()
    .add("", nodes, links, repulsion=8000)
    .set_global_opts(title_opts=opts.TitleOpts(title="基本关系网图"))
)

# 保存图表
graph.render("basic_relation_graph.html")

2. 自定义节点样式和边样式
为了使关系网图更具吸引力,我们可以自定义节点和边的样式。
from pyecharts import options as opts
from pyecharts.charts import Graph

# 构造节点和边,并为节点指定样式
nodes = [{"name": "A", "symbolSize": 50, "itemStyle": {"color": "red"}},
         {"name": "B", "symbolSize": 30, "itemStyle": {"color": "blue"}},
         {"name": "C", "symbolSize": 40, "itemStyle": {"color": "green"}}]

# 为边指定样式
links = [{"source": "A", "target": "B", "lineStyle": {"width": 2, "color": "orange"}},
         {"source": "B", "target": "C", "lineStyle": {"width": 3, "color": "purple"}}]

# 创建图表
graph = (
    Graph()
    .add("", nodes, links, repulsion=8000)
    .set_global_opts(title_opts=opts.TitleOpts(title="自定义节点和边样式"))
)

# 保存图表
graph.render("custom_style_graph.html")
3. 关系网图的层级结构
有时,我们希望展示关系网图的层级结构,使得图表更加清晰。
from pyecharts import options as opts
from pyecharts.charts import Graph

# 构造节点和边,并为节点指定层级
nodes = [{"name": "A", "symbolSize": 50, "category": 0},
         {"name": "B", "symbolSize": 30, "category": 1},
         {"name": "C", "symbolSize": 40, "category": 1}]

# 为边指定层级
links = [{"source": "A", "target": "B"}, {"source": "B", "target": "C"}]

# 创建图表
graph = (
    Graph()
    .add("", nodes, links, repulsion=8000, categories=[{"name": "Category 0"}, {"name": "Category 1"}])
    .set_global_opts(title_opts=opts.TitleOpts(title="关系网图的层级结构"))
)

# 保存图表
graph.render("hierarchical_graph.html")
4. 添加标签和工具提示
通过添加标签和工具提示,我们可以为关系网图提供更多信息。
from pyecharts import options as opts
from pyecharts.charts import Graph

# 构造节点和边,并为节点添加标签
nodes = [{"name": "A", "symbolSize": 50, "label": {"show": True}},
         {"name": "B", "symbolSize": 30, "label": {"show": True}},
         {"name": "C", "symbolSize": 40, "label": {"show": True}}]

# 为边添加工具提示
links = [{"source": "A", "target": "B", "tooltip": {"show": True, "formatter": "A与B之间的关系"}},
         {"source": "B", "target": "C", "tooltip": {"show": True, "formatter": "B与C之间的关系"}}]

# 创建图表
graph = (
    Graph()
    .add("", nodes, links, repulsion=8000)
    .set_global_opts(title_opts=opts.TitleOpts(title="添加标签和工具提示"))
)

# 保存图表
graph.render("label_tooltip_graph.html")

5. 动态关系网图
在某些场景下,我们希望展示关系的动态变化,这时可以使用动态关系网图。
from pyecharts import options as opts
from pyecharts.charts import Graph

# 构造节点和边,并为节点添加时间轴数据
nodes = [{"name": "A"}, {"name": "B"}, {"name": "C"}]
links = [{"source": "A", "target": "B"}, {"source": "B", "target": "C"}]
timeline_data = ["2022-01-01", "2022-02-01", "2022-03-01"]

# 创建动态图表
graph = (
    Graph()
    .add(
        series_name="",
        nodes=nodes,
        links=links,
        repulsion=8000,
        linestyle_opts=opts.LineStyleOpts(width=2),
    )
    .set_global_opts(
        title_opts=opts.TitleOpts(title="动态关系网图"),
        xaxis_opts=opts.AxisOpts(type_="category", boundary_gap=False),
        yaxis_opts=opts.AxisOpts(type_="value"),
        timeline_opts=opts.TimelineOpts(data=timeline_data, is_auto_play=True, is_inverse=True),
    )
)

# 保存图表
graph.render("dynamic_relation_graph.html")
6. 高级关系网图 - Les Miserables 示例
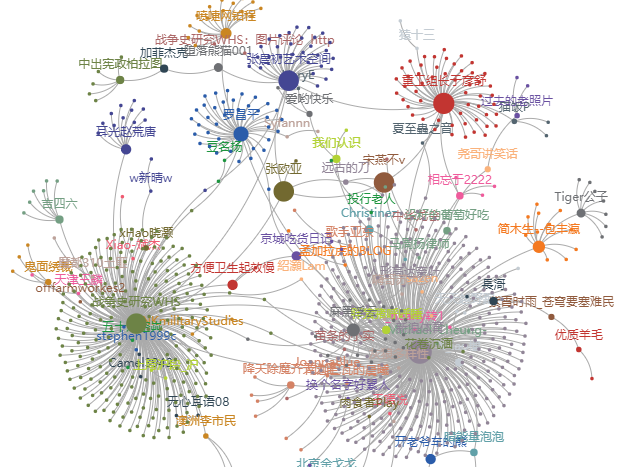
以《悲惨世界》(Les Miserables)小说中人物关系为例,展示一个更复杂的关系网图。
from pyecharts import options as opts
from pyecharts.charts import Graph

# 读取Les Miserables数据
with open("les_miserables.json", "r", encoding="utf-8") as f:
    data = f.read()
    nodes, links, categories, _ = eval(data)

# 创建图表
graph = (
    Graph()
    .add(
        series_name="",
        nodes=nodes,
        links=links,
        categories=categories,
        layout="circular",
        repulsion=50,
        is_rotate_label=True,
    )
    .set_global_opts(
        title_opts=opts.TitleOpts(title="Les Miserables 人物关系图"),
        legend_opts=opts.LegendOpts(orient="vertical", pos_left="2%", pos_top="20%"),
    )
)

# 保存图表
graph.render("les_miserables_graph.html")
以上代码中,les_miserables.json 包含了《悲惨世界》中人物的关系数据,可以从相关数据集中获取。
7. 自定义关系网图布局
Pyecharts 提供了多种布局算法,可以根据需求选择合适的布局,使关系网图更易于理解。
from pyecharts import options as opts
from pyecharts.charts import Graph

# 构造节点和边
nodes = [{"name": "A"}, {"name": "B"}, {"name": "C"}]
links = [{"source": "A", "target": "B"}, {"source": "B", "target": "C"}]

# 创建图表,指定力导向布局
graph = (
    Graph()
    .add("", nodes, links, layout="force", repulsion=8000)
    .set_global_opts(title_opts=opts.TitleOpts(title="自定义关系网图布局"))
)

# 保存图表
graph.render("custom_layout_graph.html")
8. 添加背景图
为关系网图添加背景图可以更好地展示实体之间的关系。
from pyecharts import options as opts
from pyecharts.charts import Graph

# 构造节点和边
nodes = [{"name": "A"}, {"name": "B"}, {"name": "C"}]
links = [{"source": "A", "target": "B"}, {"source": "B", "target": "C"}]

# 创建图表,添加背景图
graph = (
    Graph()
    .add("", nodes, links, repulsion=8000)
    .set_global_opts(
        title_opts=opts.TitleOpts(title="关系网图添加背景图"),
        graphic_opts=[
            opts.GraphicImage(
                graphic_item=opts.GraphicItem(id_="bg", right=0, top=0, z=-1, bounding="raw"),
                graphic_imagestyle_opts=opts.GraphicImageStyle(
                    image="background_image.jpg", width=800, height=600
                ),
            )
        ],
    )
)

# 保存图表
graph.render("background_image_graph.html")
9. 3D 关系网图
使用 Pyecharts 的 3D 功能,可以创建具有立体感的关系网图。
from pyecharts import options as opts
from pyecharts.charts import Graph

# 构造节点和边
nodes = [{"name": "A", "symbolSize": 50}, {"name": "B", "symbolSize": 30}, {"name": "C", "symbolSize": 40}]
links = [{"source": "A", "target": "B"}, {"source": "B", "target": "C"}]

# 创建3D关系网图
graph = (
    Graph()
    .add("", nodes, links, repulsion=8000, is_3d=True)
    .set_global_opts(title_opts=opts.TitleOpts(title="3D关系网图"))
)

# 保存图表
graph.render("3d_relation_graph.html")
10. 热力关系网图
通过调整边的颜色和宽度,可以呈现关系的热度。
from pyecharts import options as opts
from pyecharts.charts import Graph

# 构造节点和边
nodes = [{"name": "A"}, {"name": "B"}, {"name": "C"}]
links = [{"source": "A", "target": "B", "value": 5}, {"source": "B", "target": "C", "value": 8}]

# 创建热力关系网图
graph = (
    Graph()
    .add("", nodes, links, repulsion=8000, edge_symbol=["circle", "arrow"])
    .set_series_opts(label_opts=opts.LabelOpts(is_show=False))
    .set_global_opts(title_opts=opts.TitleOpts(title="热力关系网图"))
)

# 保存图表
graph.render("heat_relation_graph.html")
11. 细粒度控制节点和边的样式
Pyecharts 提供了细粒度的样式控制,使得我们可以更灵活地调整节点和边的外观。
from pyecharts import options as opts
from pyecharts.charts import Graph

# 构造节点和边
nodes = [
    {"name": "A", "symbolSize": 50, "itemStyle": {"color": "red", "borderColor": "black"}},
    {"name": "B", "symbolSize": 30, "itemStyle": {"color": "blue", "borderColor": "black"}},
    {"name": "C", "symbolSize": 40, "itemStyle": {"color": "green", "borderColor": "black"}},
]
links = [
    {"source": "A", "target": "B", "lineStyle": {"width": 2, "color": "orange"}},
    {"source": "B", "target": "C", "lineStyle": {"width": 3, "color": "purple"}},
]

# 创建图表
graph = (
    Graph()
    .add("", nodes, links, repulsion=8000)
    .set_global_opts(title_opts=opts.TitleOpts(title="细粒度控制节点和边的样式"))
)

# 保存图表
graph.render("fine_grained_style_graph.html")
12. 使用 Symbol 图标作为节点
Pyecharts 支持使用各种图标作为节点,提供了丰富的内置图标供选择。
from pyecharts import options as opts
from pyecharts.charts import Graph

# 构造节点和边,使用 Symbol 图标作为节点
nodes = [{"name": "A", "symbol": "circle"}, {"name": "B", "symbol": "rect"}, {"name": "C", "symbol": "triangle"}]
links = [{"source": "A", "target": "B"}, {"source": "B", "target": "C"}]

# 创建图表
graph = (
    Graph()
    .add("", nodes, links, repulsion=8000)
    .set_global_opts(title_opts=opts.TitleOpts(title="使用 Symbol 图标作为节点"))
)

# 保存图表
graph.render("symbol_as_node_graph.html")
13. 使用涟漪特效
通过使用涟漪特效,可以使关系网图更加生动有趣。
from pyecharts import options as opts
from pyecharts.charts import Graph

# 构造节点和边,添加涟漪特效
nodes = [{"name": "A"}, {"name": "B"}, {"name": "C"}]
links = [{"source": "A", "target": "B"}, {"source": "B", "target": "C"}]

# 创建图表
graph = (
    Graph()
    .add("", nodes, links, repulsion=8000, is_roam=True, is_focusnode=True)
    .set_global_opts(title_opts=opts.TitleOpts(title="使用涟漪特效"))
)

# 保存图表
graph.render("ripple_effect_graph.html")

14. 动态修改关系网图数据
Pyecharts 支持动态修改关系网图的数据,使得图表能够实时更新。
from pyecharts import options as opts
from pyecharts.charts import Graph

# 初始节点和边数据
initial_nodes = [{"name": "A"}, {"name": "B"}, {"name": "C"}]
initial_links = [{"source": "A", "target": "B"}, {"source": "B", "target": "C"}]

# 创建图表
graph = Graph().add("", initial_nodes, initial_links, repulsion=8000)

# 设置全局配置
graph.set_global_opts(title_opts=opts.TitleOpts(title="动态修改关系网图数据"))

# 保存初始状态图表
graph.render("dynamic_data_graph_initial.html")

# 动态修改数据
new_nodes = [{"name": "D"}, {"name": "E"}]
new_links = [{"source": "D", "target": "E"}]

# 更新图表
graph.add("", new_nodes, new_links)
graph.render("dynamic_data_graph_updated.html")
15. 使用自定义的关系算法
Pyecharts 允许用户使用自定义的关系算法,以更好地控制节点之间的关系。
from pyecharts import options as opts
from pyecharts.charts import Graph

# 构造节点和边
nodes = [{"name": "A", "symbolSize": 50}, {"name": "B", "symbolSize": 30}, {"name": "C", "symbolSize": 40}]
links = [{"source": "A", "target": "B"}, {"source": "B", "target": "C"}]

# 创建图表,使用自定义的关系算法
graph = (
    Graph()
    .add(
        "",
        nodes,
        links,
        layout="circular",
        repulsion=8000,
        edge_symbol=["circle", "arrow"],
        edge_symbol_size=[4, 10],
    )
    .set_global_opts(title_opts=opts.TitleOpts(title="使用自定义的关系算法"))
)

# 保存图表
graph.render("custom_relation_algorithm_graph.html")
16. 使用 MarkLine 增强关系图
在关系图中,有时候我们希望通过 MarkLine 来强调某些特殊的关系,这样可以更加直观地传达信息。
from pyecharts import options as opts
from pyecharts.charts import Graph

# 构造节点和边
nodes = [{"name": "A"}, {"name": "B"}, {"name": "C"}]
links = [{"source": "A", "target": "B"}, {"source": "B", "target": "C"}]

# 创建图表,使用 MarkLine 增强关系图
graph = (
    Graph()
    .add("", nodes, links, repulsion=8000)
    .set_global_opts(
        title_opts=opts.TitleOpts(title="使用 MarkLine 增强关系图"),
        visualmap_opts=opts.VisualMapOpts(pos_left="right", pos_top="center", orient="vertical"),
    )
    .set_series_opts(
        label_opts=opts.LabelOpts(is_show=False),
        linestyle_opts=opts.LineStyleOpts(width=2, opacity=0.6),
    )
    .add(
        series_name="",
        data_pair=links,
        linestyle_opts=opts.LineStyleOpts(width=1, opacity=0.3, curve=0.3, type_="dotted"),
        markline_opts=opts.MarkLineOpts(
            symbol=["none", "none"],
            linestyle_opts=opts.LineStyleOpts(width=2, type_="solid"),
            data=[opts.MarkLineItem(type_="average", name="平均值")],
        ),
    )
)

# 保存图表
graph.render("markline_relation_graph.html")
17. 在关系图中添加动态效果
通过设置 is_animation 参数,我们可以为关系图添加动态效果,增强可视化的吸引力。
from pyecharts import options as opts
from pyecharts.charts import Graph

# 构造节点和边
nodes = [{"name": "A"}, {"name": "B"}, {"name": "C"}]
links = [{"source": "A", "target": "B"}, {"source": "B", "target": "C"}]

# 创建图表,添加动态效果
graph = (
    Graph()
    .add("", nodes, links, repulsion=8000, is_animation=True)
    .set_global_opts(title_opts=opts.TitleOpts(title="关系图添加动态效果"))
)

# 保存图表
graph.render("animated_relation_graph.html")
18. 关系图的异步加载
对于大规模的关系图,为了提高性能,可以使用异步加载的方式,按需加载数据。
import time
from pyecharts import options as opts
from pyecharts.charts import Graph

# 模拟异步加载数据
def load_data() -> tuple:
    time.sleep(2)  # 模拟加载耗时
    nodes = [{"name": "A"}, {"name": "B"}, {"name": "C"}]
    links = [{"source": "A", "target": "B"}, {"source": "B", "target": "C"}]
    return nodes, links

# 创建图表,异步加载数据
graph = Graph(init_opts=opts.InitOpts(width="100%", height="800px"))

# 通过 add_js_funcs 方法调用异步加载数据的函数
graph.add_js_funcs(load_data)

# 设置全局配置
graph.set_global_opts(title_opts=opts.TitleOpts(title="关系图异步加载"))

# 保存图表
graph.render("async_load_relation_graph.html")
19. 自定义关系图背景
通过设置 graphic_opts 参数,我们可以为关系图添加自定义的背景元素,增强图表的美观度。
from pyecharts import options as opts
from pyecharts.charts import Graph

# 构造节点和边
nodes = [{"name": "A"}, {"name": "B"}, {"name": "C"}]
links = [{"source": "A", "target": "B"}, {"source": "B", "target": "C"}]

# 创建图表,添加自定义背景
graph = (
    Graph()
    .add("", nodes, links, repulsion=8000)
    .set_global_opts(
        title_opts=opts.TitleOpts(title="自定义关系图背景"),
        graphic_opts=[
            opts.GraphicRect(
                graphic_item=opts.GraphicItem(0, 0, width="100%", height="100%", transparent=True),
                graphic_shape_opts=opts.GraphicShapeOpts(
                    fill="rgba(0,0,0,0.3)"
                ),
            )
        ],
    )
)

# 保存图表
graph.render("custom_background_relation_graph.html")
20. 在关系图中使用 Tooltip
通过添加 Tooltip,我们可以在关系图中展示更详细的信息,提高图表的信息传达能力。
from pyecharts import options as opts
from pyecharts.charts import Graph

# 构造节点和边
nodes = [{"name": "A", "value": 10}, {"name": "B", "value": 20}, {"name": "C", "value": 15}]
links = [{"source": "A", "target": "B"}, {"source": "B", "target": "C"}]

# 创建图表,添加 Tooltip
graph = (
    Graph()
    .add("", nodes, links, repulsion=8000)
    .set_global_opts(
        title_opts=opts.TitleOpts(title="关系图使用 Tooltip"),
        tooltip_opts=opts.TooltipOpts(formatter="{b}:{c}"),
    )
)

# 保存图表
graph.render("tooltip_relation_graph.html")
通过这些示例,我们进一步了解了 Pyecharts 绘制多种炫酷关系图的技巧和方法。这些功能的灵活运用可以使你更好地定制和呈现关系图,展示出更丰富和有趣的信息。在实际应用中,你可以根据需求灵活运用这些技巧,为关系图增色添彩。

总结
在本篇技术博客中,我们深入学习了使用 Pyecharts 绘制多种炫酷关系图的方法,包括基本关系图、自定义样式、布局控制、动态效果、异步加载、背景定制、MarkLine 增强关系图、Tooltip 使用等多个方面。以下是一些总结和重要的观点:
-
基本关系图绘制: 我们从最基础的关系图开始,介绍了如何构造节点和边,并使用 Pyecharts 创建简单而直观的关系图。
-
自定义样式: 通过自定义节点和边的样式,我们可以使关系图更具个性,符合实际应用场景的需求。
-
布局控制: Pyecharts 提供了多种布局算法,允许用户根据需要选择合适的布局方式,以更好地呈现关系图。
-
动态效果和异步加载: 通过设置动态效果和异步加载,可以增强关系图的可视化效果,使用户交互更加流畅。
-
背景定制和图表增强: Pyecharts 提供了灵活的背景定制和图表增强功能,使用户可以更好地美化关系图,突出重点信息。
-
MarkLine 增强关系图: 使用 MarkLine 可以在关系图中强调某些特殊的关系,提高图表的信息传达能力。
-
Tooltip 使用: 添加 Tooltip 可以在关系图中展示更详细的信息,提供更好的用户体验。
通过这些技巧,我们可以创建出各种各样炫酷、直观、有趣的关系图,从而更好地理解和展示复杂的数据关系。同时,Pyecharts 提供了丰富的功能和参数,使得用户在可视化过程中具有更大的灵活性和创造力。希望读者能够根据本文的指导,更好地利用 Pyecharts 创建出令人印象深刻的关系图,为数据可视化工作带来更多的灵感和创新。
标签:
相关文章
最新发布
- 光流法结合深度学习神经网络的原理及应用(完整代码都有Python opencv)
- Python 图像处理进阶:特征提取与图像分类
- 大数据可视化分析-基于python的电影数据分析及可视化系统_9532dr50
- 【Python】入门(运算、输出、数据类型)
- 【Python】第一弹---解锁编程新世界:深入理解计算机基础与Python入门指南
- 华为OD机试E卷 --第k个排列 --24年OD统一考试(Java & JS & Python & C & C++)
- Python已安装包在import时报错未找到的解决方法
- 【Python】自动化神器PyAutoGUI —告别手动操作,一键模拟鼠标键盘,玩转微信及各种软件自动化
- Pycharm连接SQL Sever(详细教程)
- Python编程练习题及解析(49题)
点击排行
- 版本匹配指南:Numpy版本和Python版本的对应关系
- 版本匹配指南:PyTorch版本、torchvision 版本和Python版本的对应关系
- Anaconda版本和Python版本对应关系(持续更新...)
- 相关性分析——Pearson相关系数+热力图(附data和Python完整代码)
- Python 可视化 web 神器:streamlit、Gradio、dash、nicegui;低代码 Python Web 框架:PyWebIO
- Windows上安装 Python 环境并配置环境变量 (超详细教程)
- Python与PyTorch的版本对应
- 安装spacy+zh_core_web_sm避坑指南

