首页 > Python资料 博客日记
matplotlib多图合一的四种实现(多张图显示在一个figure中)
2024-03-17 07:00:04Python资料围观277次
这篇文章介绍了matplotlib多图合一的四种实现(多张图显示在一个figure中),分享给大家做个参考,收藏Python资料网收获更多编程知识
Subplot多合一显示
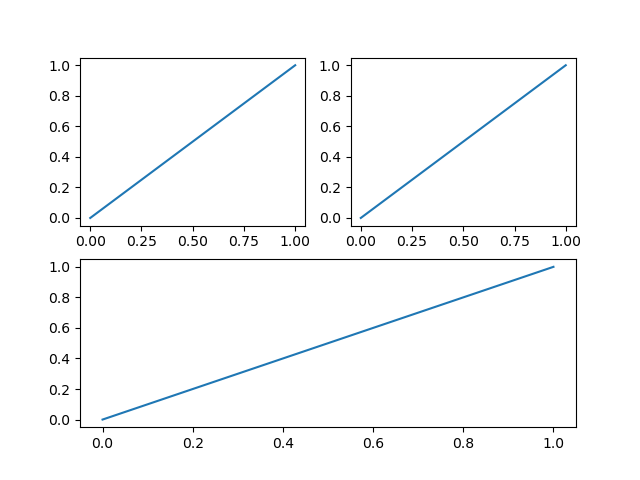
1 plt.subplot
使用plt.subplot(rownum, columnnum, index)说明新图纸是几行几列的
import matplotlib.pyplot as plt

plt.figure()
plt.subplot(2, 2, 1)
plt.plot([0, 1], [0, 1])

plt.subplot(2, 2, 2)
plt.plot([0, 1], [0, 1])

plt.subplot(2, 1, 2)
plt.plot([0, 1], [0, 1])

plt.show()
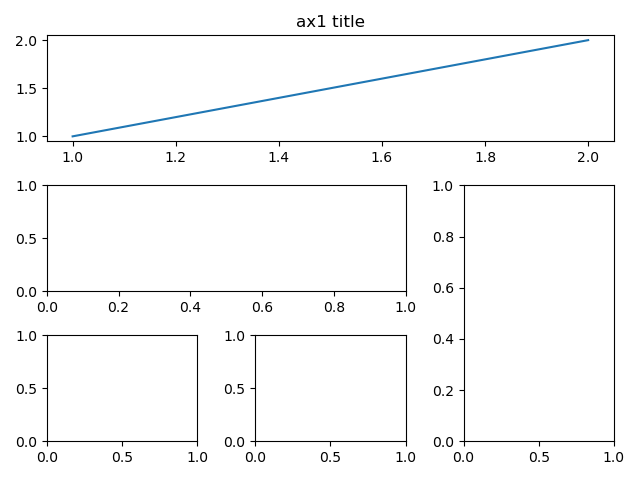
2 plt.subplot2grid
使用plt.subplot2grid(总格数, 起始格数, rowspan, colspan)来绘制
import matplotlib.pyplot as plt

plt.figure()
ax1 = plt.subplot2grid((3, 3), (0, 0), colspan=3, rowspan=1)
ax1.plot([1, 2], [1, 2])
# 设置某属性的时候需要在前面加set_
ax1.set_title("ax1 title")

ax2 = plt.subplot2grid((3, 3), (1, 0), colspan=2)
ax3 = plt.subplot2grid((3, 3), (1, 2), rowspan=2)
ax4 = plt.subplot2grid((3, 3), (2, 0))
ax5 = plt.subplot2grid((3, 3), (2, 1))

plt.tight_layout()
plt.show()
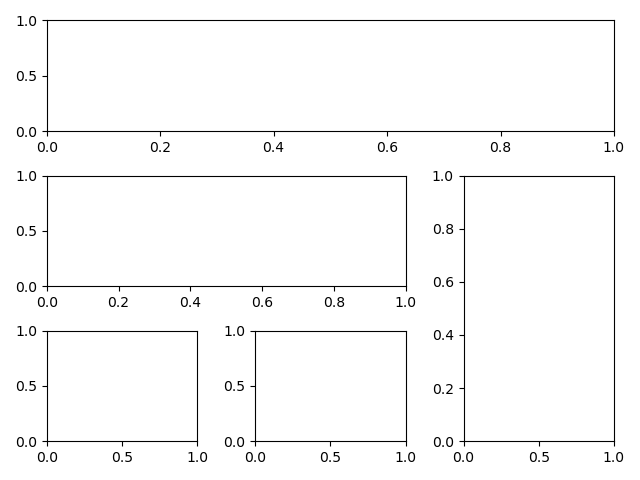
3 gridspec.GridSpec
首先使用gridspec.GridSpec(rownum, colnum)声明将figure分割成几块,然后在绘图时使用切片声明使用哪几块即可
import matplotlib.pyplot as plt
import matplotlib.gridspec as gridspec

plt.figure()
gs = gridspec.GridSpec(3, 3)
ax1 = plt.subplot(gs[0, :])
ax2 = plt.subplot(gs[1, :2])
ax3 = plt.subplot(gs[1:, 2])
ax4 = plt.subplot(gs[2, 0])
ax5 = plt.subplot(gs[2, 1])

plt.tight_layout()
plt.show()
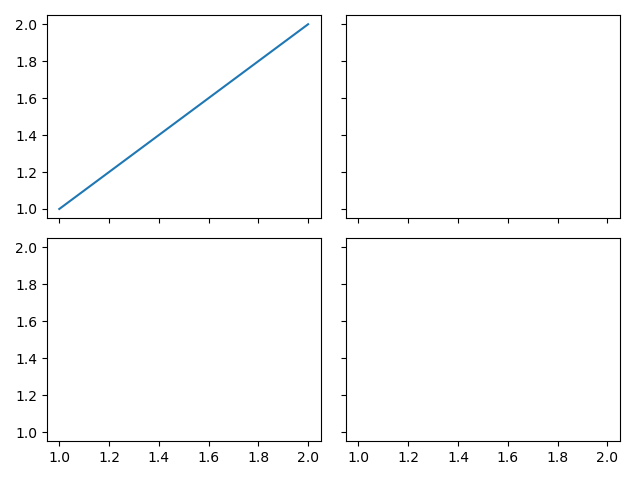
4 plt.subplots
import matplotlib.pyplot as plt
import matplotlib.gridspec as gridspec

f, ((ax11, ax12), (ax21, ax22)) = plt.subplots(2, 2, sharex=True, sharey=True)
ax11.plot([1, 2], [1, 2])

plt.tight_layout()
plt.show()
版权声明:本文来自互联网用户投稿,该文观点仅代表作者本人,不代表本站立场。本站仅提供信息存储空间服务,不拥有所有权,不承担相关法律责任。如若内容造成侵权/违法违规/事实不符,请联系邮箱:jacktools123@163.com进行投诉反馈,一经查实,立即删除!
标签:
相关文章
最新发布
- 光流法结合深度学习神经网络的原理及应用(完整代码都有Python opencv)
- Python 图像处理进阶:特征提取与图像分类
- 大数据可视化分析-基于python的电影数据分析及可视化系统_9532dr50
- 【Python】入门(运算、输出、数据类型)
- 【Python】第一弹---解锁编程新世界:深入理解计算机基础与Python入门指南
- 华为OD机试E卷 --第k个排列 --24年OD统一考试(Java & JS & Python & C & C++)
- Python已安装包在import时报错未找到的解决方法
- 【Python】自动化神器PyAutoGUI —告别手动操作,一键模拟鼠标键盘,玩转微信及各种软件自动化
- Pycharm连接SQL Sever(详细教程)
- Python编程练习题及解析(49题)
点击排行
- 版本匹配指南:Numpy版本和Python版本的对应关系
- 版本匹配指南:PyTorch版本、torchvision 版本和Python版本的对应关系
- Anaconda版本和Python版本对应关系(持续更新...)
- 相关性分析——Pearson相关系数+热力图(附data和Python完整代码)
- Python 可视化 web 神器:streamlit、Gradio、dash、nicegui;低代码 Python Web 框架:PyWebIO
- Windows上安装 Python 环境并配置环境变量 (超详细教程)
- Python与PyTorch的版本对应
- 安装spacy+zh_core_web_sm避坑指南
本站推荐
